Performance · 34.5 GB of evidence · Umbraco 13 · .NET 8 · AWS Fargate
Six OOM-kills and a comment that lied
A performance investigation and the cost of provisioning for a defect
A content-management service kept exhausting 60 GB of memory and getting killed. Two plausible fixes failed. The dominant cost was an XPath path retained at all six call sites; an interface doc-comment had warned developers that the cheaper indexed alternative was the more resource-intensive one.
The three-edit fix bundle removed the XPath lookup and two redundant traversals. Under comparable live traffic, mean promotion latency fell from 69.80 s to 0.166 s, peak CPU from 8,091 to 624 units, and peak memory from 60,547 to 3,378 MiB. Six OOM kills had occurred in the preceding eight days; none was observed during the 8.4-hour validation window, and completed publishes per hour rose. The CPU trace and complexity analysis identify the XPath removal as the dominant change; the before-and-after measurement covers all three edits together.
The symptom¶
Bursty, non-reproducible, and always somebody else's code
The service publishes video metadata. One of its jobs is licence promotion: when an episode finishes playing, a message arrives and the episode's provisional broadcast licences are promoted to live ones, which cascades into sibling episodes, seasons and series.
Under bursts of promotions the container walked up to the memory ceiling and was killed by the platform. It happened six times over eight days. Operations that should take under a second took minutes — a measured worst case of 6 minutes 27 seconds for a single request.
The dominant samples were in CMS framework internals rather than our business logic, so reading our code told us nothing. And it was burst-correlated — invisible under steady traffic, so it never reproduced on demand.
What the heap actually contained¶
A process dump settled in one table what three weeks of reasoning had not
The service runs as a single task on AWS Fargate, which gives you no host to log into. Getting
a CPU trace and a heap dump out of a container that dies only when it misbehaves was most of the
work: a dotnet-monitor sidecar sharing a volume with the app container, the app started
with DOTNET_DiagnosticPorts, collection rules triggering dotnet-trace and
dotnet-dump, and the artefacts pushed straight to object storage because a 34 GB
file is not coming back through a shell. The sidecar took six separate fixes before it produced
anything — starting with the fact that it defaults to Connect mode, which does not support
collection rules at all.
The original heap dump, trace, log exports and telemetry extracts contain proprietary production data and cannot be published. The analysis therefore exposes the method rather than the raw artefacts: fixed UTC windows, named instruments, aggregate object counts, caller-tree shares, before-and-after measurements, and explicit limits on what each result establishes.
| Instrument | What it answered |
|---|---|
| CloudWatch Container Insights | CpuUtilized and MemoryUtilized as absolute CPU units and MiB. Service-level percentages hide the real figure, and you cannot size anything from a percentage |
| New Relic APM | per-transaction latency, databaseCallCount, error.class, and the application's own log lines — the only source that survived every session expiry |
| dotnet-trace, via the sidecar | the CPU caller tree captured during a live 99% peg — this is what produced the 41.57% figure |
| dotnet-dump, via the sidecar | the 34.5 GB heap dump, and with it the type census below |
| CMS backoffice, authenticated | index health, true property values, and a live probe of the fixed lookup against real content |
Once we had the dump, the answer was not subtle. The dump file was 34.5 GB. SOS reported 31,536,395,863 bytes in the managed GC heap, holding 423,555,895 objects at capture time. Over half of that heap was a single namespace.
XmlDocument + NameTable adapter, per call. That reading comes from inspecting the framework source and is corroborated by the census fingerprint below, rather than from instrumenting the allocation site itself. The
fingerprint is DocumentXPathNavigator at 8,224,875 instances present at capture:
a count consistent with roughly 8.2 million adapter graphs of what should be short-lived per-query scratch state. The process had only 86 threads, which made thread-pool ballooning an implausible primary explanation.| Type | Instances | Bytes | Share of heap |
|---|---|---|---|
| System. | 138,563,003 | 5,542,520,120 | 17.6% |
| System. | 8,224,875 | 4,408,533,000 | 14.0% |
| System. | 8,224,875 | 2,434,563,000 | 7.7% |
| System. | 8,661,956 | 2,425,347,680 | 7.7% |
| System. | 15,189,833 | 1,093,667,976 | 3.5% |
| System. | 15,189,833 | 850,630,648 | 2.7% |
| System. | 8,224,875 | 399,790,416 | 1.3% |
| System. | 8,224,875 | 394,794,000 | 1.3% |
| System. | 6,964,958 | 278,598,320 | 0.9% |
| System. | 8,224,875 | 197,397,000 | 0.6% |
| Ten largest System.Xml types | 225,693,958 | 18,025,842,160 | 57.2% |
That single row is the whole incident in one number. We were asking for that adapter on a hot path, once per lookup, and the scratch state was accumulating faster than the collector retired it.
Two fixes that did not work¶
Both were evidence-led. Both were wrong about the dominant cost.
This is the part worth keeping, because being wrong twice is how the dominant cost was isolated.
Attempt one: move the aggregate rebuild off the publish thread
One promotion triggered 1+N publishes, each synchronously rebuilding whole season and series models — roughly O(N²) per promotion in episodes-per-season. A background dispatch queue with per-node lanes fixed the crash mechanism: lock errors went to zero and the lock-related restarts stopped. It did not reduce the cost. A burst still reached 97–99% CPU and 90%+ memory.
Attempt two: reorder so the indexed lookup runs first
The code had two ways to resolve a node by identifier: an XPath query over the content tree, and a lookup against the search index. It tried XPath first. So we reordered: try the index, fall back to XPath only on a miss. Latency fell from 92 s to single digits within minutes — and then a second OOM arrived under a bigger burst. The fresh trace showed XPath dominating more than before, at 41.57% of CPU.
That result is the most useful thing in this investigation, so it is worth doing the arithmetic.
Let c_e and c_x be the per-call costs of the indexed and XPath lookups, and
p the probability the index misses. Under index-first ordering, expected cost per
resolution is:
E[c] = c_e + p · c_x
The sampled trace estimates the aggregate contribution of both terms over the capture window: 41.57% of CPU samples in the XPath call against
0.09% in the indexed one. So p · c_x / c_e ≈ 462, and the XPath term
accounted for 99.78% of the cost of resolving content by identifier even with the index
tried first.
p · c_x / c_e = 1/9 — a
reduction in p by a factor of 462 ÷ (1/9) ≈ 4,200. Reducing the fallback invocation probability by three and a half orders of magnitude was never on the table. The counterfactual holds every other per-call cost constant and treats that probability as the only lever.
There is a second, sharper reason reordering could not work, and it is easy to miss: the fallback was invoked only when the indexed lookup missed. It therefore ran, essentially always, in its own worst case — the miss, where nothing can stop the tree enumeration early. The code was structured so that the expensive path was reached exclusively under the input distribution that maximises its cost.
One term in that arithmetic needs qualifying. The case-sensitivity defect described later
— the index query matching case-insensitively while the filter over its results compared
ordinally — sent case-mismatched identifiers to the fallback, and the XPath path had been
silently normalising case before anyone knew it was doing so, so index-first ordering measured a
p the defect had raised by an amount the trace cannot separate out. That does not
make the measurement wrong: 41.57% against 0.09% is what the system did, and it is
the system that was running. It does mean the counterfactual deserves a bound rather than an
assertion, and the bound is unforgiving — reducing p by the roughly
4,200× required above means all but one miss in about four thousand would have to
have been case-induced, with every other cause, including a promotion arriving for content that
has no matching episode, accounting for under 0.03% of misses. Fixing the comparison would
have lowered p. It could not have cleared that bar in a workload where promotions
routinely arrive for content that has no matching episode.
The comment¶
Two methods, one cost warning, and it was on the wrong one
Which raises the real question: why would anyone write six call sites that prefer the expensive path? Nobody chose it on a hunch. They read the interface. Here it is as it stood, with both declarations next to each other:
public interface IContentSearcher{ /// <summary> /// Searches published content using XPath /// </summary> /// <param name="xpath">XPath. e.g.: /root/mediaLibrary//series[externalSeriesId='1234']</param> /// <returns>Content id. Null if not found</returns> int? GetPublishedContentId(string xpath); /// <summary> /// Searches content based on type and a property value. As this searches through /// non-published items too, it's more resource-intensive. /// </summary> /// <returns>Content id. Null if not found</returns> int? GetContentId(string contentType, string property, string value);}
Read it as a developer picking a method. The XPath one carries no cost note at all. The indexed one carries the only performance warning in the file — “it's more resource-intensive”. On that evidence, preferring XPath is not carelessness; it is the reasonable reading of the documented contract.
Then measure them. The method with no warning: 41.57% of CPU. The method carrying the warning: 0.09%. In this workload the warning pointed in the wrong direction by a factor of roughly 500, and it did so in the most expensive possible direction — it encouraged every caller to retain the path associated with the 8.2 million navigator instances present at capture.
There is a third detail worth noticing, because it is the part that scales the damage. The XPath
method's <param> tag supplies a worked example:
/root/mediaLibrary//series[…]. That example uses // — the descendant axis, the very construct that makes the walk linear in the whole subtree in this unindexed implementation. So the
documentation did three things at once: it omitted any cost warning from the expensive method, it put
the file's only cost warning on the cheap one, and it handed every reader a copy-pasteable template
of the expensive pattern.
The comment was not nonsense. GetContentId genuinely does search unpublished items as
well, so it genuinely does more work in a scope sense — the sentence is true about
behaviour and catastrophically wrong about cost. That is what let it survive review
for years: anyone checking it would confirm the premise and never question the conclusion. A
plausible mechanism attached to an unmeasured cost claim is more durable than an obvious error.
The title is shorthand, not a claim that documentation itself allocated the memory. The runtime defect was the XPath path. The comment's role was sociotechnical: it inverted the apparent cost of the two APIs, made the expensive choice look prudent, and helped that choice persist across six call sites.
The change¶
Three edits, no new abstractions, no new dependencies
1. Remove the XPath fallback from all six lookups. Not deprioritised — removed, then removed from the interface too, so reintroducing it is a compile error. For the content types, fields and index configuration used here, the indexed path covered the published and unpublished current content these lookups require — which the XPath query did not.
// before — XPath first, indexed lookup as the fallbackvar contentId = ContentSearcher.GetPublishedContentId( $"/root/{DocumentTypes.MediaLibrary}//{DocumentTypes.Series}/{DocumentTypes.Season}" + $"/{DocumentTypes.Episode}[externalTitleId='{externalTitleId.ToLower()}']") ?? ContentSearcher.GetContentId("episode", "externalTitleId", externalTitleId); // aftervar contentId = ContentSearcher.GetContentId(DocumentTypes.Episode, "externalTitleId", externalTitleId);
2. Replace recursive tree walks with fixed-depth traversal. A helper used
Descendants() — a full recursive walk through the same navigation machinery. The
content-type schema permits series to contain only clips and seasons, seasons only clips and episodes, and episodes only clips and video assets — so an episode cannot exist anywhere but exactly two levels down.
seriesPublishedContent.Descendants().Where(x => x.ContentType.Alias.InvariantEquals("episode"))seriesPublishedContent.Children.SelectMany(season => season.Children) .Where(x => x.ContentType.Alias.InvariantEquals(DocumentTypes.Episode))
3. Delete a second, redundant walk that recomputed the most-recent-episode date the whole tree over. The same method had already materialised an episode projection at its top and was using it for two other fields; the date was derivable from that list, so the walk bought nothing.
// before — a second full recursive walk, for one datemodel.MostRecentEpisodeUpdate = GetMostRecentEpisodeUpdate(publishedContent); private DateTime GetMostRecentEpisodeUpdate(IPublishedContent publishedContent){ var episodes = publishedContent.Descendants() .Where(d => d.ContentType.Alias == "episode") .ToList(); if (!episodes.Any()) return DateTime.MinValue; return episodes.Max(e => e.UpdateDate);} // after — the projection is already in hand; the helper is gonemodel.MostRecentEpisodeUpdate = DateTimeHelper.GetMaxOrDefault(DateTime.MinValue, episodes.Select(e => e.UpdateDate));
The framework is moving the same way independently: the XPath lookup API is marked
[Obsolete] in v13 and XPath traversal is removed entirely in v14+, with
“use search methods instead” as the stated guidance.
This concerns an Umbraco 13 system, and the XPath lookup was already marked [Obsolete]
when this code ran. That does not make the incident merely historical. Umbraco 13 is in its final
security phase and reaches end-of-life on 14 December 2026. Upgrading is not routine: v14
replaced the AngularJS backoffice with a Web Components implementation, requiring AngularJS-based
custom backoffice extensions to be migrated or rewritten, while v14 through v16 have themselves
already reached end-of-life. For teams moving from v13, v17 is the next supported LTS destination.
The XPath traversal APIs are removed in v14+, so an upgrade requires these call sites to be
replaced; teams remaining on v13 can make the same change without a version upgrade or new
dependency. The wider purpose of this article is to examine a failure mode that outlives the API
— an expensive fallback implementation, reinforced by misleading documentation, became a
routine production path and went on to shape both application behaviour and infrastructure sizing.
Nor is it an argument that XPath is inherently defective. XPath remains appropriate for a great deal of XML processing. The failure here came from using subtree traversal as a repeated lookup mechanism on a hot path, where an index that already existed offered a fundamentally better access pattern.
Why it is asymptotically better, not just faster¶
Two data structures, one question, and a gap that is structural
Two structures were available for the same question — find the node whose property
p equals v. One is an ordered tree with no secondary index; the other
is an inverted index built for exactly this.
In XPath, // expands to a descendant-or-self step, producing candidates from the subtree to which the predicate is then applied. The specification fixes that meaning, not a physical execution strategy — but in this path there was no secondary index for the property predicate, so a miss required examining the whole candidate subtree. The framework
drives a navigator cursor over the in-memory tree — pointer-chasing, with no index to consult.
A miss is Θ(N) in the node count under the search root. The census above accounts for 2,584 of them — series, season, episode, videoAsset. The schema also permits clip nodes at three levels, which the walk enumerates and which are not counted there, so treat 2,584 as a floor rather than a total. The bound does not rest on the exact figure, only on N growing with the library.
Because the result is consumed with FirstOrDefault() over a lazy iterator, the walk terminates
early on a hit, so the honest bound is best case O(1), expected N/2 visits if exactly one match is uniformly distributed in traversal order — still
Θ(N), since a constant factor does not survive the notation — and worst case
Θ(N).
The index path has different asymptotics entirely. Examine 3.8 sits on Lucene.NET 4.8, whose term dictionary is a block-tree with a finite state transducer index held in memory. Resolving a term costs O(|t|) in the length of the term string — one FST transition per character — then a seek into the postings block and O(df) to iterate matching documents, per segment. Writing DF for the total document frequency across all S segments:
T_index = O(S · |t| + DF) versus T_walk = Θ(N)
Here DF = 1, because identifiers are unique, and |t| is bounded by the identifier format at around ten characters. There is no term proportional to scanning all N content nodes. Examine resolves the term through Lucene’s indexed structures without walking the content tree, and for this short, unique-identifier lookup the cost was effectively insensitive to catalogue size next to the linear content-tree scan. What remains is the segment count S, which merge policy
keeps small rather than letting it track library size. This is not a claim that Lucene
is constant-time in general: a longer term, a high document frequency, or a different query
shape each reintroduce a factor that grows. It is the specific reason this lookup does not scale with the catalogue the way the tree walk does — and why the gap widens every month the catalogue grows.
Space was the term that actually killed the process
Time complexity explains the latency. It does not explain the OOM-kills, and the space behaviour is
the more interesting half. Building an XmlDocument adapter per call allocates in proportion to the properties materialised into it, with no pooling or caching evident in the source path.
Transient allocation of that kind is survivable; a generational collector is built for exactly that.
The heap census and the rising memory telemetry together showed that this was not harmless transient allocation. Constructing the adapter added allocation proportional to the content materialised into it, and under the burst workload those allocations were produced faster than the runtime reclaimed them, so the managed heap climbed toward the task limit. That is an observed allocation-and-reclamation imbalance, not a measured growth law: a single snapshot cannot establish that the live set scales linearly in call count.
This is the formal reason more memory was never the fix, and why both earlier attempts bought time rather than a solution. A larger heap does not remove an allocation source that outruns reclamation — it may extend the time to failure, but only at additional infrastructure cost. The underlying instability remains. Removing the allocation site changes the problem instead.
Whether those 8.2 million graphs were permanently reachable (a retention bug) or merely being created faster than the collector could retire them is not settled from a single snapshot. Both readings produce the same observable behaviour under sustained load — a managed heap that climbs toward the task limit rather than settling — and both are removed by deleting the call.
The traversal change, quantified honestly
Replacing Descendants() is a constant-factor improvement, not an asymptotic one, and it
is worth resisting the temptation to overstate it. Collecting every episode of a series is inherently
Θ(E) in episodes; both versions must touch all of them. What changed is the set of nodes
visited: a recursive descent also visits the asset level below episodes, while the two-level version
stops where episodes stop. Across the live corpus that is 2,404 nodes versus 1,838 —
23.5% fewer, the saving being precisely the 566 asset nodes. Both counts exclude clip nodes, as the
census does. A 1.31× reduction in nodes
visited does not explain the measured improvement, and this article should not pretend it does. The
real cost was per-node, not node count: every step went through the same navigator machinery the CPU
trace found dominating.
What the numbers did¶
Same environment, same live traffic, absolute windows
Resource figures below come from CloudWatch Container Insights in absolute units; latency, database calls and error classes come from New Relic. Every window is an explicit absolute range rather than a relative one, because “the last eight hours” returns a different answer every time it runs, which makes a result impossible to check.
| Measure | Before | After | Change |
|---|---|---|---|
| Mean promotion latency | 69.80 s | 0.166 s | 420× faster |
| Worst promotion latency | 386.68 s | 12.14 s | 32× faster |
| Peak CPU (of 8,192 units) | 8,091 | 624 | 13× lower |
| Peak memory (of 61,440 MiB) | 60,547 | 3,378 | 18× lower |
| DB calls per transaction | 268 | 419 | +56% |
| Content items published / hour | 20.7 | 36.3 | rose |
| HTTP 400 (client validation) | 11 | 440 | rose sharply |
| OOM kills observed | 6 in 8 days | 0 in 8.4 h | none in the window |
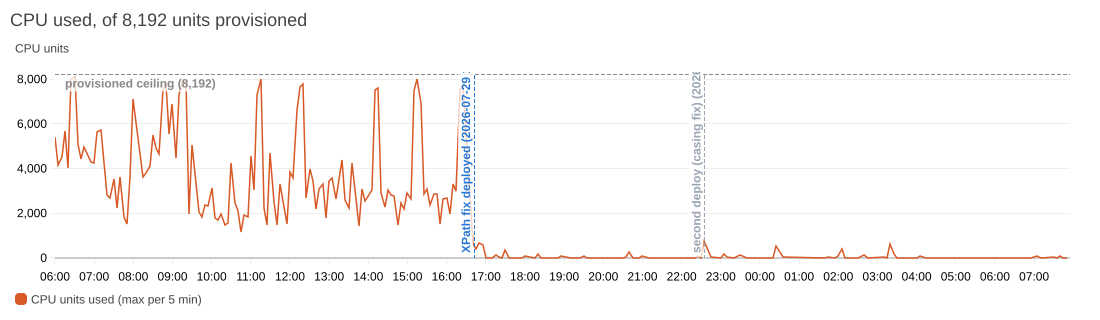
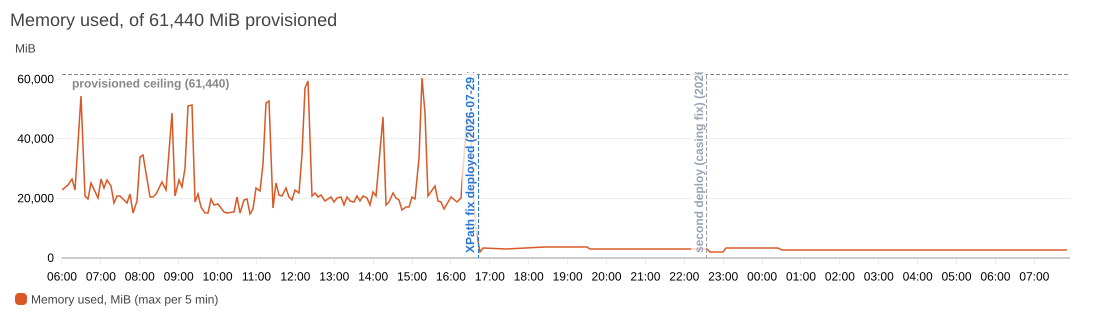
GetMetricWidgetImage API rather than redrawn here, so the
shape can be compared against the charts above without taking my plotting on trust. Nothing is
edited except the two things a reader needs: the y-axis is pinned to the provisioned ceiling
rather than auto-scaled, and the two deployments are marked. The collapse sits at the first marker,
16:42; the small step at the second, 22:35, is the later build carrying the
case-sensitivity fix. Everything after that second marker is the window the results table measures.Drag either handle, or drag across the strip to select a window. Arrow keys once a handle is focused.
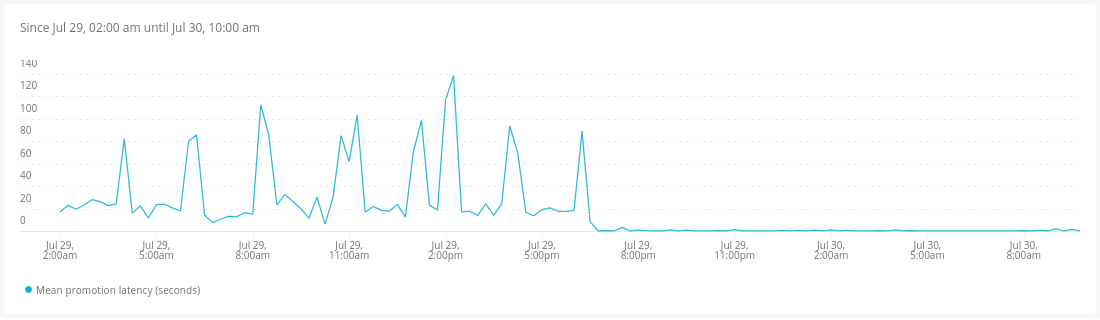
WITH TIMEZONE clause does not override it. The collapse at roughly 18:40 here is
therefore the same 16:42 UTC deployment marked in the CloudWatch figure above.Drag either handle, or drag across the strip to select a window. Arrow keys once a handle is focused.
Why the zoom matters. At full range the post-deploy line sits on the floor, which proves nothing about accumulation. Select just the right-hand side and the axis rescales into the 2,600–3,600 MiB band, where the shape becomes legible: it rises during the first burst, falls back, and then holds. Drift across the whole post-deploy window is +964 MiB — and that is warm-up from a 1,850 MiB cold start, not a climb; select from 18:00 onward and the drift is close to flat.
Drag either handle, or drag across the strip to select a window. Arrow keys once a handle is focused.
Worth zooming into the right-hand side: the post-deploy line is not flat, it is bursty at a small amplitude. Every promotion burst is still visible as a spike — the work is plainly still happening, it just costs tens of units instead of thousands. The single largest post-deploy spike, 765 units, is task start-up rather than load.
The rise deserves a sentence rather than a victory lap. Two things contribute. In the before window transactions were dying — the process was killed six times — so their database work never finished and the per-transaction average is depressed. And a promotion that now completes runs three sibling updaters that previously never got to run. What the figure establishes is only direction: a silent no-op drives calls per transaction toward zero, not up by half. It was not isolated further, and if the increase is not fully accounted for by those two effects, that deserves its own look.
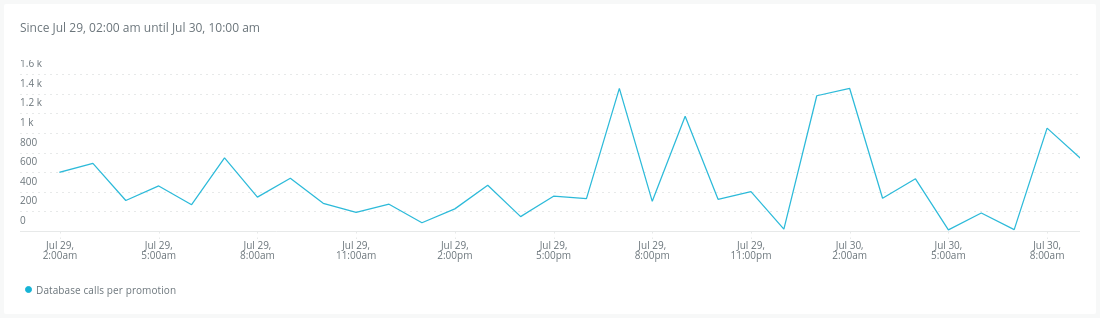
HTTP 400s rose sharply, from 11 to 440. Those are client-side validation rejections —
the caller sending malformed requests, not the service failing — so they sit outside this
change, but it is a real increase and worth a look at what the caller is sending. One error class
also moved the wrong way: a single ArgumentException appeared that was not there
before. Stated because a results table that only moves one way is not a results table.
Four sources, cross-checked¶
Proving the system is stable, that operations execute, and that this is not a no-op
This is the part that makes the result trustworthy rather than merely encouraging. A fix that makes a service stop doing work looks identical on a resource graph to a fix that makes it efficient: both show flat CPU and low memory. Having just deleted a code path that resolves content, the obvious failure mode was a silent no-op — lookups returning nothing, promotions skipping quietly, and the graphs looking magnificent.
No single instrument can settle that, because each is blind to what the others see. CloudWatch knows resource but not whether requests succeeded. New Relic knows transactions but not whether the search index behind them is healthy. The sidecar sees inside the process but says nothing about content. The backoffice shows content state but not load. So all four were run together, each answering a question the others structurally cannot.
| Question | Source | Evidence |
|---|---|---|
| Is the process stable, or quietly restarting? | CloudWatch + ECS | the same task ran the whole 8.4-hour window with zero restarts |
| Is memory accumulating? | CloudWatch Container Insights | peaked 3,378 MiB, settled to ~2,800 and held flat for 5 h — it came down, so GC is reclaiming |
| Was the load actually comparable? | New Relic — Transaction | 73.1 promotions/hour after against 75.4/hour before — the same offered load |
| Are requests completing, not failing? | New Relic — TransactionError | the whole contention family (499, BadHttpRequest, Win32, Panic, 503, Sql) at zero |
| Is real work done per request? | New Relic — databaseCallCount | 268 → 419 DB calls per transaction; an early return drives this toward zero |
| Does a promotion run end to end, or stop partway? | New Relic — Logs | the handler's own lifecycle lines reconcile: 615 Processing licence promotion for {X} entries, of which 40 reached the save point (Primary promotion for {X} completed) and all 40 then reached the terminal line (Licence promotion pipeline completed successfully for {X}) — nothing lost between writing content and finishing the sibling updaters. XKD418-207 traces start → document published → EpisodeUpdated dispatched → siblings run → completed. The rest resolved to no matching episode or no eligible licence |
| Is content genuinely written? | New Relic — Logs | the line that fires only after SaveAndPublish succeeds and its result validates: 305 items in 8.4 h, each naming the specific item written — XKD418-207, PLM503-014, TQV771-026 (identifiers throughout this article are synthetic stand-ins, consistent per item, not real catalogue codes) |
| Is more or less being completed? | New Relic — Logs | content published per hour rose: 20.7/h before → 36.3/h after |
| Is the index the fix now depends on healthy? | Umbraco backoffice (auth) | InternalIndex reports healthy, holding 2,677 documents that reconcile exactly with a per-type census |
| Do lookups resolve real content? | Umbraco backoffice + live endpoint | read true externalRef values off episode nodes, then promoted them — found and processed |
| Could we still capture a dump if it recurred? | dotnet-monitor sidecar | trigger → action → S3 egress observed working end-to-end before it was needed |
One line of output for the whole system
Rather than checking four consoles by hand, the four sources were consolidated into a single polling loop, emitting one line every 150 seconds with a severity tag. Each tick carried: CPU and memory from CloudWatch; the running task count, task-definition revision and the sidecar container's status from ECS; promotion count, mean and worst latency plus a full error-class breakdown from New Relic; and the last-modified timestamp of each diagnostic artifact in S3, flagged the moment one changed.
The severity rules mattered as much as the data: warn above 60% memory or 99% CPU; alert above 80% memory, or if the task count left 1, or worst latency passed 60 seconds, or the sidecar stopped running, or a new dump fired. That last condition is the useful one — it turns a capture into a notification instead of something you discover later.
It earned its keep twice. It caught an unrelated build being deployed onto the service overnight, because the revision field changed and the sidecar row went blank. And because New Relic authenticates separately from AWS, it kept reporting through two overnight AWS session expiries that blanked every AWS-sourced field — which is precisely the argument for consolidating independent sources rather than more views of one.
Every one of them was green. The cross-check still could not see a real defect that was live at that moment, reporting Success: true — which is the next section, and the reason telemetry alone is never the last step.
The bug the telemetry could not see¶
Found by driving the real system by hand
Every metric was healthy. So the last check was to call the live endpoint directly with a real identifier — and then with the same identifier in the wrong case:
| Request | Response | Meaning |
|---|---|---|
| 7HQV84-311 | “licence not updated” | episode found |
| 7hqv84-311 | “episode not tracked” | episode not found |
Same episode. The deleted XPath had been normalising case before querying —
ToUpper() on references, ToLower() on title identifiers — and because
it ran first, it silently rescued any casing. Five lookups lost that when it was removed. Worse, the
endpoint maps a missing episode to HTTP 200 with Success: true. The caller sees
success and never retries, so a lookup miss is an invisible dropped promotion.
The mechanism was an internal inconsistency: the index query matches case-insensitively — verified directly, both casings return the same document set — but the filter applied to its results compared ordinally, discarding a document the query had deliberately matched. One line:
.Any(v => v == value).Any(v => string.Equals(v, value, StringComparison.OrdinalIgnoreCase))
Five regression tests were added — the first this class had. They were verified to fail against the previous comparison before being accepted, because a regression test that has never failed is not evidence of anything.
Four lessons that outlive the API¶
The XPath call is deprecated. These are not.
A comment is an API surface
A doc-comment that inverts the relative cost of two code paths will propagate a wrong decision to every call site that reads it. Here it did so six times, over years, and no amount of reading our own code would have revealed it — the comment was the most authoritative-looking thing in the file, and it was wrong by a factor of roughly 500. Cost claims in documentation should carry a measurement or not be made.
Branch ordering cannot rescue a fallback already dominating by hundreds-fold
Cheap-primary-with-expensive-fallback is a pattern people write constantly: cache then database, index then scan, memo then recompute. The expected-cost arithmetic is unforgiving. When the fallback already accounts for hundreds of times the primary's aggregate cost, its rate never has to be high to dominate, and reordering is not a lever — only elimination is. Worse, if the fallback is reached only when the primary misses, it runs permanently in its own worst case.
Telemetry proves work happened, not that it was correct
Every dashboard was green while a case-sensitivity defect was silently dropping requests and returning HTTP 200 with a success body. No metric can see that, because from the outside it is indistinguishable from a legitimate no-op. Only driving the real system with a deliberately awkward input found it.
Per-call allocation can become sustained heap pressure
An adapter, bridge or converter built fresh per call is fine when the objects die with the call. When they are created faster than they are reclaimed, per-call allocation becomes sustained heap pressure and the process acquires a finite lifetime. That failure mode is invisible in a latency graph and unfixable with a bigger heap — capacity only moves the constant.
Appendix A
What the capacity was actually worth¶
Infrastructure comes with a bill, and a well-balanced decision shows up on it
This section is kept separate because it answers a different question, not because it is weaker evidence: every figure in it comes from the same measured peak as the rest of the article. It is here because a performance decision that stops at “CPU went down” is only half an engineering decision.
The important point is the sequencing. Provisioning had been chosen to mirror the footprint of the system being replaced, not to match measured load — and while a defect was driving resource consumption, no honest sizing was possible at all. Rightsizing is downstream of correctness. Only once the fix landed did the real numbers appear: a steady-state peak of 0.61 vCPU and 3.3 GiB against 8 vCPU and 60 GiB provisioned. That is the steady-state peak, and the headroom multiples below are measured against it. The highest single reading anywhere in the 26 hours was 765 units (0.75 vCPU), and it was task start-up rather than load — taken against that figure instead, the provisioned size still carries 10.7× CPU headroom and stage 2 carries 2.7×, so the sizing conclusion does not depend on which peak is used. Costs below are AWS Fargate on-demand list prices for ap-southeast-2, running 24/7, so every figure is reproducible from the public pricing API. Rates were retrieved on 30 July 2026 for Linux/x86 tasks and cover vCPU and memory only; ancillary charges — public IPv4, log ingestion, data transfer, additional ephemeral storage — are unchanged by resizing and are outside this model.
| Task size | CPU headroom | Memory headroom | $ / month | Annualised run-rate saving |
|---|---|---|---|---|
| 8 vCPU / 60 GiB — as provisioned | 13.1× | 18.2× | 516.61 | — |
| 4 vCPU / 16 GiB — stage 1 | 6.6× | 4.9× | 203.93 | 3,752 |
| 2 vCPU / 8 GiB — stage 2 | 3.3× | 2.4× | 101.97 | 4,976 |
| 1 vCPU / 4 GiB — rejected | 1.6× | 1.2× | 50.98 | 5,587 — rejected |
What these figures mean. They are annualised avoidable-capacity costs at public
on-demand rates, calculated as (current monthly run rate − candidate monthly run rate)
× 12. They are not savings already realised on an invoice. The run-rate reduction
begins only when the task definition is resized, and the amount actually realised may differ
under Savings Plans, negotiated discounts or other contracted pricing.
The recommendation is staged rather than aggressive, for a reason worth stating: a cold start has a much higher memory peak than steady state, and that peak was never captured. The first post-deploy reading is 1,850 MiB, but CloudWatch samples in five-minute buckets and can step straight over a short hydration spike, so treat that as a floor rather than the peak. Sizing to a 3.3 GiB steady state without that number is the one place this analysis could bite — a cold boot that does not fit does not merely slow down, it fails, restarts, retries and fails again. Stage 1 is the immediately supportable next step: it keeps 4.9× memory headroom and captures $3,752/year of annualised run-rate reduction at public rates while creating a prudent point at which to measure cold-start memory. Once that peak is observed and fits with adequate margin, stage 2 becomes the validation-dependent target, increasing the annualised run-rate reduction to $4,976/year. The smallest size is rejected outright: it offers only about $50/month more reduction than stage 2 for 1.2× memory headroom, which is not a trade worth making.
Where the over-provisioning came from
The pattern is visible across the three environments the new system runs in; two further environments are still awaiting the rollout and are not costed here. The system it replaced ran two tiers: an upper tier at 14,336 CPU units and roughly 58 GiB, and a lower tier at a quarter of the processor and a fifth of the memory.
| Environment | New system CPU / MiB | Prior system CPU / MiB | Prior tier |
|---|---|---|---|
| Testing | 8,192 / 61,440 | 14,336 / 59,007 | upper |
| UAT | 8,192 / 61,440 | 3,584 / 12,288 | lower |
| DevTest | 8,192 / 32,768 | 3,584 / 12,288 | lower |
The new system flattened that upward, though not uniformly. UAT was lifted from the lower tier to 8,192 / 61,440 — the allocation Testing runs on the upper tier — while DevTest, on the identical prior footprint, was given 8,192 / 32,768. Two environments with the same old allocation received different new ones. Nobody derived any of these numbers from load; they were inherited, and then not revisited. That is the whole mechanism, and it is a common shape after a migration: capacity is carried across as a safety measure and never comes back down.
The modelled run-rate reduction above is for one environment, and it is the only one measured — the new system is not yet deployed beyond these three, so there is no second bill to count. The larger value is not on any invoice: a known memory-exhaustion failure was removed before the rollout reached the two environments still awaiting it, which carry 3.8× and 5.1× UAT’s promotion rate — measured per environment over the fixed 24-hour window in Appendix B. The failure was triggered at the lowest of those rates.
Appendix B
Limits of this analysis¶
Stated so nobody has to find them
Every measured figure above comes from one of these windows. They are absolute rather than relative because a query written as “the last eight hours” returns a different answer each time it runs, which makes a result impossible to check.
| Window | Span (UTC) | Used for |
|---|---|---|
| Before | 2026-07-29 06:00 → 2026-07-29 16:42 | 10.7 h, ending at the deployment. CPU and memory panels, promotion latency, error classes. |
| After | 2026-07-29 22:40 → 2026-07-30 07:05 | 8.4 h. The same panels, plus publishes and stability. |
| Load | 2026-07-29 08:00 → 2026-07-30 08:00 | Fixed 24 h. Promotion and transaction rates per environment. |
| Response time | 2026-07-29 00:00 → 2026-07-30 08:00 | 32 h in 15-minute buckets, spanning the deployment. |
| Memory and CPU zoom | 2026-07-29 06:00 → 2026-07-30 07:55 | 26 h in 5-minute buckets. |
- Observational, not controlled. This is a before-and-after under live traffic, not an A/B experiment. The offered promotion rate is close across the two windows (75.4/h against 73.1/h), but a similar rate does not guarantee an identical content mix or request complexity.
- One environment, one workload. Every measured figure, including the capacity and cost analysis, comes from the single environment where the promotion workload runs. The other environments receive no comparable promotion traffic, so they offer no valid before-and-after; no wider rollout cost is claimed.
- Raw artefacts are not public. The dump, trace and telemetry exports contain proprietary production data. Readers can inspect the method, aggregate outputs, calculations and cross-checks, but cannot independently re-run the original production artefacts.
- The largest ratios are the softest. “420× faster” is arithmetically correct, but the before state included process kills and restarts, so part of that mean is queueing on a dying process. The claim that survives unaided is the CPU-share measurement — 41.57% against 0.09%, taken on a live, running process.
- Three edits, one measurement. All three changes shipped together, so the before-and-after is for the bundle. The complexity argument and the CPU trace both attribute the dominant share to the XPath removal, but the traversal changes were never isolated and measured on their own.
- Observation windows are hours, not weeks. Memory was tracked in CloudWatch across 26 hours spanning the deployment. That is good evidence that nothing accumulates within a day. It is not evidence about a slow leak over a month.
- The economics are modelled. Prices are AWS Fargate on-demand list prices for ap-southeast-2; the sizing is derived from measured peaks with stated headroom. The cold-start peak remains unmeasured, which is why the recommendation is staged.
References¶
The complexity argument
- XML Path Language (XPath) 1.0, §2.5 — Abbreviated SyntaxEstablishes the semantics of
//as a descendant-or-self step. The linear miss cost discussed here follows from this particular unindexed execution path, not from a universal requirement on every XPath implementation. - System.Xml.XPath.XPathNavigatorThe cursor API the CMS implements for tree traversal. Evaluation is a pointer-chasing walk driven through this interface, with no index for a predicate to consult.
- Manning, C. D., Raghavan, P., & Schütze, H. (2008). Introduction to Information Retrieval. Cambridge University PressChapters 1–3: the standard treatment of the inverted index — why a term dictionary plus postings list answers an equality lookup without touching the corpus, and where the
dfterm comes from. - McCandless, M. (2010). Using finite state transducers in LuceneHow Lucene applies FSTs to the term dictionary. Relevant because Examine 3.8 resolves to Lucene.NET 4.8, which uses the block-tree terms dictionary with an in-memory FST index — the basis for the O(|t|) term resolution.
- Apache Lucene.NET 4.8 API —
BlockTreeTermsReaderThe primary source for the structure the previous entry describes, and for the library actually in use here rather than its Java counterpart: “a block-based terms index and dictionary that assigns terms to variable length blocks according to how they share prefixes. The terms index is a prefix trie whose leaves are term blocks.” It also states thatSeekExact()can often rule a term out with no I/O at all — which is the exact operation an equality lookup on a unique identifier performs.
How it was measured
- Amazon CloudWatch Container Insights metrics for Amazon ECSDefinitions of
CpuUtilizedandMemoryUtilized. These are absolute — CPU units and MiB — which is why they, and not service-level percentages, are used for every sizing figure. - dotnet-monitor — collection rules and egress providersThe trigger/action configuration that produced the dump, including the Listen diagnostic-port mode that collection rules require in order to function at all.
- dotnet-dump and dotnet-traceHeap and CPU analysis tooling. Caller-tree attribution needed a custom TraceEvent walk, because the
dotnet-traceCLI reports only a flat top-N.
Asymptotics and memory
- Cormen, T. H., Leiserson, C. E., Rivest, R. L., & Stein, C. (2022). Introduction to Algorithms, 4th ed. MIT PressChapter 3, for the formal definitions of O, Θ and Ω used here — in particular why an expected N/2 visits is still Θ(N), since constant factors do not survive the notation.
- Fundamentals of garbage collection (.NET)Explains that collection depends on object reachability. A single heap snapshot does not establish permanent retention, which is why this analysis distinguishes a retention bug from allocation being produced faster than the collector could reclaim it.
The platform's own direction
- Umbraco CMS — ExamineThe supported search abstraction, and the internal index that covers published and unpublished content. This is the basis for the claim that, for the content types and index configuration used here, the indexed lookup covered the published and unpublished current content these lookups require — which the XPath query did not.
- Umbraco Announcements — removal of XPath querying
GetByXPathis[Obsolete]in v13 and the XPath traversal APIs are removed in v14+, with search recommended instead. The change therefore moves toward the platform rather than away from it. - Umbraco 13 — End-of-LifeThe source for the v13 dates: released 14 December 2023, the 24-month support phase ended 14 December 2025, and end-of-life falls on 14 December 2026, after which only Extended Long-Term Support carries security patches. Stated as a date rather than a support status, because the status expires and the date does not.
- Umbraco — Long-term Support and End-of-LifeThe lifecycle table covering the versions between: v14 reached end-of-life on 30 May 2025, v15 on 14 November 2025 and v16 on 12 June 2026, all standard-term releases. Umbraco 17, released 27 November 2025, is the current LTS and the next supported LTS destination from v13.
- Umbraco CMS — Breaking Changes OverviewThe basis for the upgrade-cost claim: v14 removed AngularJS in favour of a backoffice built with Web Components, Lit and the Umbraco UI Library, which the documentation calls “by far the most impactful update of Umbraco in years” because it changes how the backoffice is extended. AngularJS-based extensions must be migrated or rewritten.
How the costs were derived
- AWS Price List GetProducts APIThe authoritative source for the rates used: service code
AmazonECS, usage typesAPS2-Fargate-vCPU-Hours:perCPU($0.04856) andAPS2-Fargate-GB-Hours($0.00532), Asia Pacific (Sydney). - AWS Fargate pricingThe per-vCPU-hour and per-GB-hour model. Rates were taken from the API above and cross-checked against this page.
- Amazon ECS task definition parametersThe discrete CPU/memory combinations Fargate permits. This constrains the candidate sizes in Appendix A: memory options are fixed per vCPU tier, so 4 vCPU/16 GiB and 2 vCPU/8 GiB are real options rather than interpolations.